Updates from Letty – November 16, 2018
Blog posts are the personal views of Letty Hardi and not official statements or records on behalf of the Falls Church City Council
Dear Friends,
I probably say this every week, but we had a busy and interesting agenda this week – really! From walkability to the return of the 3T bus line to financials to the evolving demographics of the city, there’s something for everyone. And, we continued to deliberate and discuss the proposals for the 10 acre West Falls Church site in closed session, as we hope to select the top ranked proposal soon.
The long awaited Amazon news came this week too. With 25,000 new jobs coming to our neighbor Arlington, this is a big win for the entire region. Other new businesses will want to locate around Amazon, more employees and clients will spend money in our stores and restaurants – I do believe this is “a rising tide that lifts all boats”. Also, this will clearly have implications on housing, transportation, and other infrastructure for everyone – Falls Church included – that will need a lot of more investment ahead.
Before getting to business – reminder for your weekend: we have another Sunday Series Town Hall on Sunday at 2 pm, Community Center. This is a good chance to get the latest on the West Falls Church economic development and new high school project, where the final GMHS schematic design is expected to be presented and before site plan submission in December. Ahead of Thanksgiving, we still have a City Council meeting scheduled for next Monday at 730 pm as well.
Best,
Letty
What Happened This Week:
(1) Walkability – “missing link” sidewalk on Park and N. Virginia
We heard strong, compelling testimony from neighbors to complete the sidewalk near the intersection of Park Ave and N. Virginia, which is a heavily trafficked stretch of Park Ave with library/farmer’s market/park-goers, and anyone heading east into the downtown area. As part of the Great Streets project for Park Ave, we have funds available for improvement to Park Ave. I’ve been an advocate for more sidewalks and completing the Park/Virginia sidewalk addresses a key walkability and pedestrian safety concern. We have the rare alignment of strong neighborhood consensus + support from the immediate property owners during redevelopment of their property + available funds – and I believe we should act. There was unanimous support among City Council and the City Manager indicated there will be preliminary engineering and a schedule proposal, so it’s looking positive!
(2) FY2019 – Q1 financials
With the caveat that it’s too early in the financial year to draw trends, there was a mixed bag of financial results in the first quarter report – personal property taxes were slightly lower; licenses and permit fees continue to be lower until revenue from Founders Row permits comes in; meals and sales tax were up; there was also slight underspending across city departments. I think it’s important for us to closely monitor for warning signs in the economy, especially in advance of next year’s revenue forecasts and the kickoff of the FY20 budget, planned at our annual joint budget meeting with the School Board on December 5th.
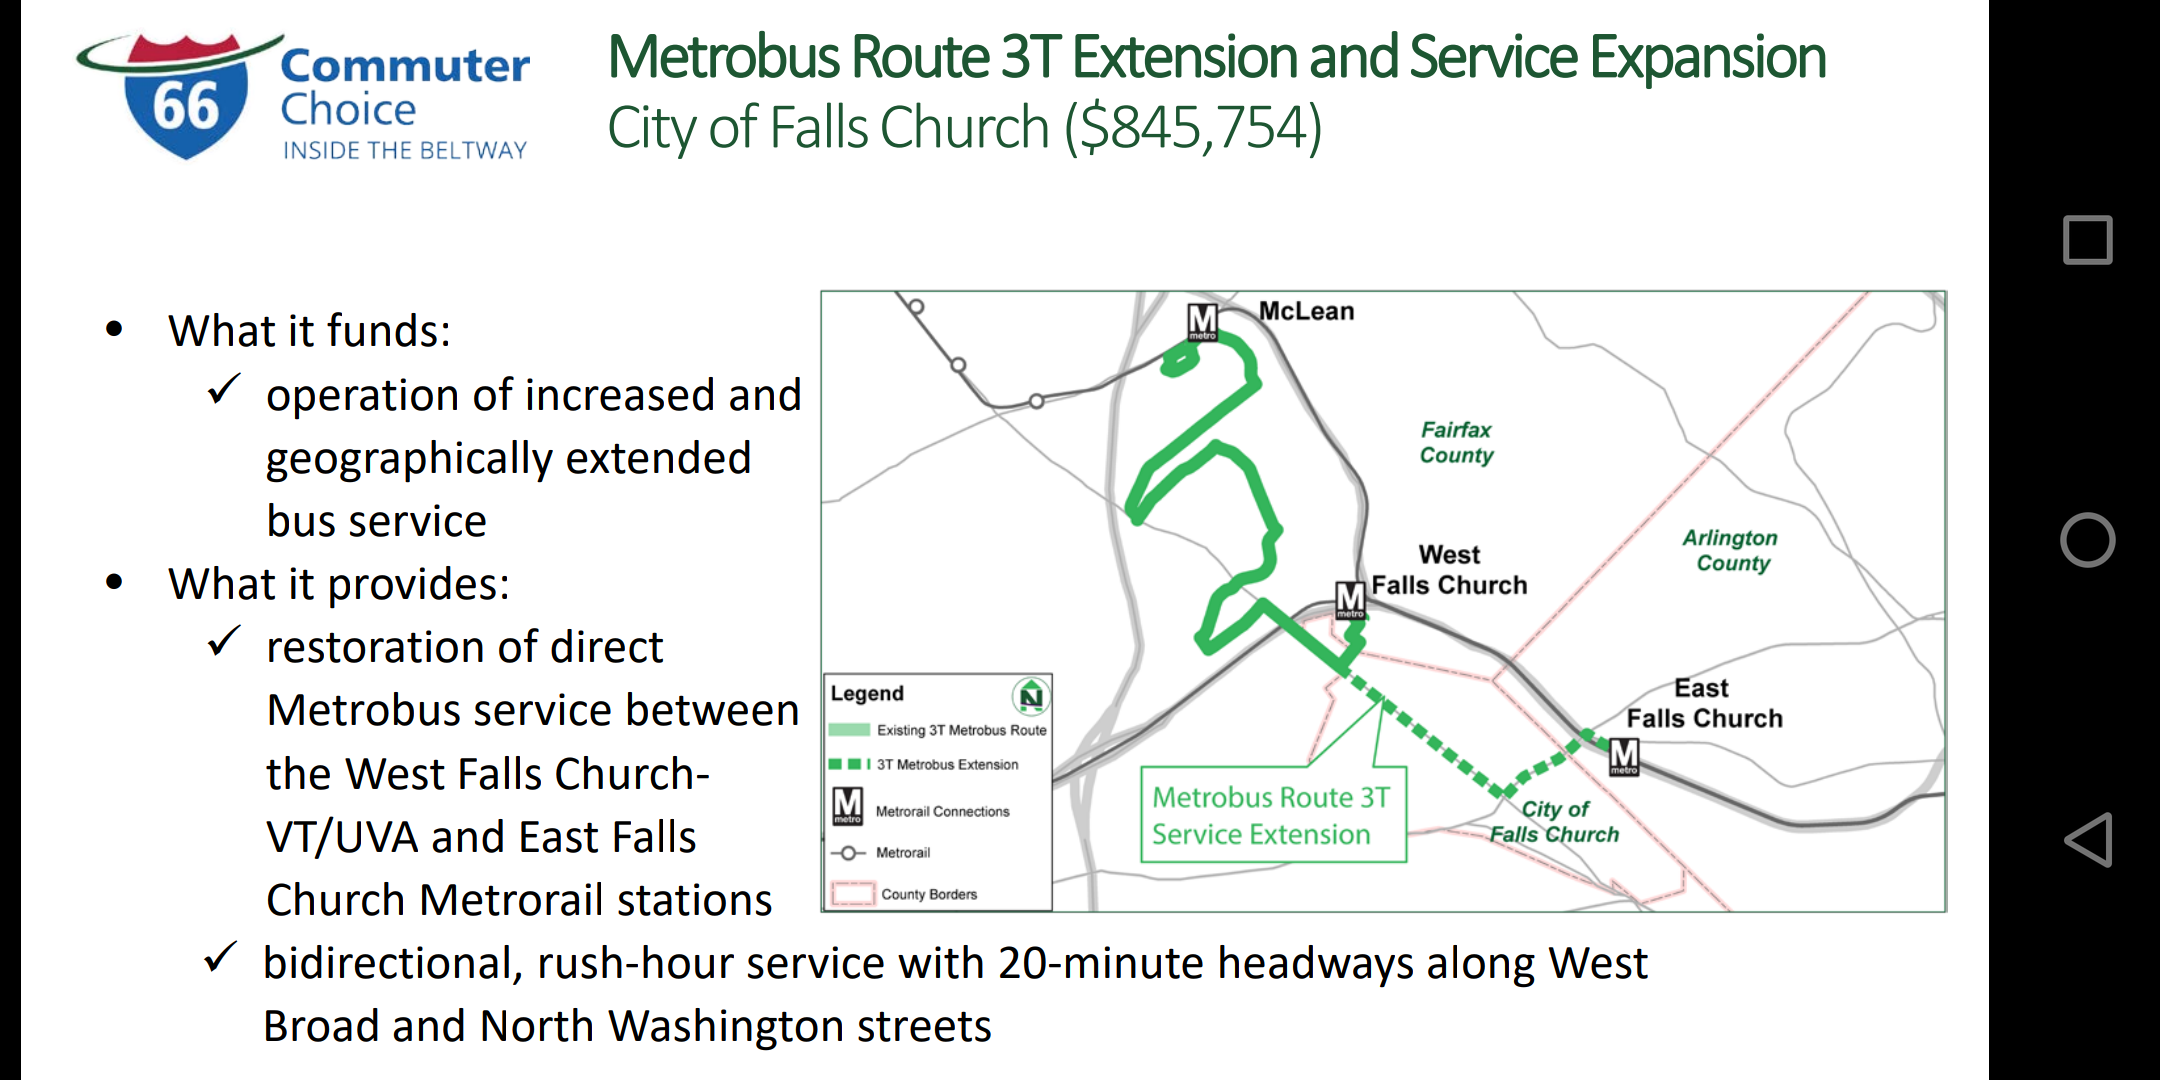
(3) Metrobus 3T – coming back!
Good news! The Metrobus 3T line is returning to Falls Church, beginning Jan 2, 2019. The bus route through Falls Church was discontinued in 2016 and I remember hearing from many citizen commuters about the impact. Using the new I-66 toll revenue, this week we authorized the agreement to fund and resume the operation of the 3T bus line through Falls Church during rush hour, connecting West to East Falls Church metro stations along Broad St. and N. Washington, for 2 years.
(4) Demographics Report
As part of the update to the city’s Comprehensive Plan (the Comp Plan is our primary policy document that guides planning and growth of the city – across transportation, housing, industry, public facilities, environmental protection, energy efficiency, historic preservation, parks and recreation, and social and economic sustainability), changes in demographics and projections of the city are important inputs. The last update to the demographics chapter was done in 2005.
Key (and some surprising to me) takeaways – the full report and presentation are available:
- Population Growth
- As of 2017, there were approximately 14,583 people living in the City. Between 2010 and 2017 the City’s population grew by an estimated 2,251 people – about 18.3% or about 2.6% annually. Population growth is driven by natural increase (i.e. births minus death) plus net migration. If the current pace of growth continues, more population growth will have occurred the decade between 2010 and 2020, than the two previous decades combined (1990 to 2010).
- Growth in recent years has been primarily driven by people living alone and renters without children. The change in housing stock (ie, addition of studio and one-bedroom units) is the reason that childless households have been a key driver of growth in the City.
- Population Mix
- Millennials – millennials are a growing share of the City’s population, though the increase is less than in some adjacent areas. There were approximately 1,740 people between the ages of 25 and 34 living in Falls Church in 2016. The number of residents in this age group has increased by about 9.7% over five years, similar to other inside-the-Beltway communities.
- School Age – the number of school-age children in the City is increasing, but the growth rate has been slower than in other Northern Virginia communities. There were approximately 2,475 school-age children (age 5 to 17) living in Falls Church in 2016, which is 17.4% more than 2011.
- 55+ – about 1 in 4 Falls Church residents are age 55+. In 2016, there were approximately 3,481 people age 55 or older living in Falls Church, an increase of 23.5% over 2011 with similar growth. Similar growth is occurring throughout the region and nationally, as expected as the youngest boomers continue to age into this segment.
- Households with Children
- We continue to be attractive to families, but the number of households with children has actually declined by 5.3% between 2011 and 2016, reflecting the sharpest decline in Northern Virginia. At first, I thought this was a “denominator issue” – because we’ve added more households without children, the proportion of households with children is smaller. However, the demographers have actually found that the absolute number of households with children has decreased – from 1688 households in 2011 to 1598 households in 2016. Still, about 30% of our households have children.
- “3 is the new 2” with homeowners – the data also suggest another interesting trend: a subset of families in Falls Church is having more children than in the past. We’ve seen an an increase in school-age children, yet the number of households with children has declined. The data reflect a pattern of some households – namely homeowners – having more children. The average household size in the City went from 2.46 in 2011 to 2.56 in 2016 and this increase was driven by homeowners, with an average household size increasing from 2.65 in 2011 to 2.93 in 2016. The average size of renter households actually declined during this same time period, going from 2.15 to 2.0. Between 2011 and 2016 the number of households with 3 or more children grew by 20.4%, primarily among homeowners, while the number of households with 1 or 2 children declined by 9.8%.
- Diversity – Racial & Socioeconomic
- Falls Church is one of the least racially and ethnically diverse communities in a diversifying region – nearly 3 out of 4 residents in the City are non-Hispanic white (72.1%) and by contrast, communities adjacent to the City of Falls Church are some of the most racially diverse in the region. Interestingly, the new residents of the the City are more diverse – of the residents added to the City’s population over the past 5 years, 58.1% are white and 41.9% are non-white.
- The city remains one of the highest-income areas in the Northern Virginia region. Approximately 4 out of 10 households in the city have an annual income of $150,000+. Falls Church has seen a surge in households that have incomes between $50,000 and $100,000. Approximately 1 out of 4 households has a household income between $50,000 and $100,000, reflecting a 44.4% increase over five years ago, likely due to the rise in one-person households. Falls Church is the only community in the region to have a surge in this income range and most neighboring communities have had a decline.
The next steps of this demography work will include projections through 2040 – important to guide planning and policy decisions for housing, facilities, public safety, etc. We also discussed comparing this to the annual school enrollment forecasts done by Weldon Cooper.
What’s Coming Up:
November is #LiveLocalFC month! Are you up for the challenge of keeping 20% more of your spending in the City during November?
- Sunday, November 18 – Sunday Series Town Hall (2 pm, Community Center)
- Monday, November 19 – City Council Meeting (730 pm, Community Center)
- Monday, November 26 – Downtown Tree Lighting (6 pm, 100 Block of W. Broad)
- Monday, November 26 – City Council Meeting & Work Session (730 pm, Community Center)
- Monday, December 3 – Joint City Council & School Board Work Session (730 pm, Community Center)
- Monday, December 10 – City Council Meeting (730 pm, Community Center)